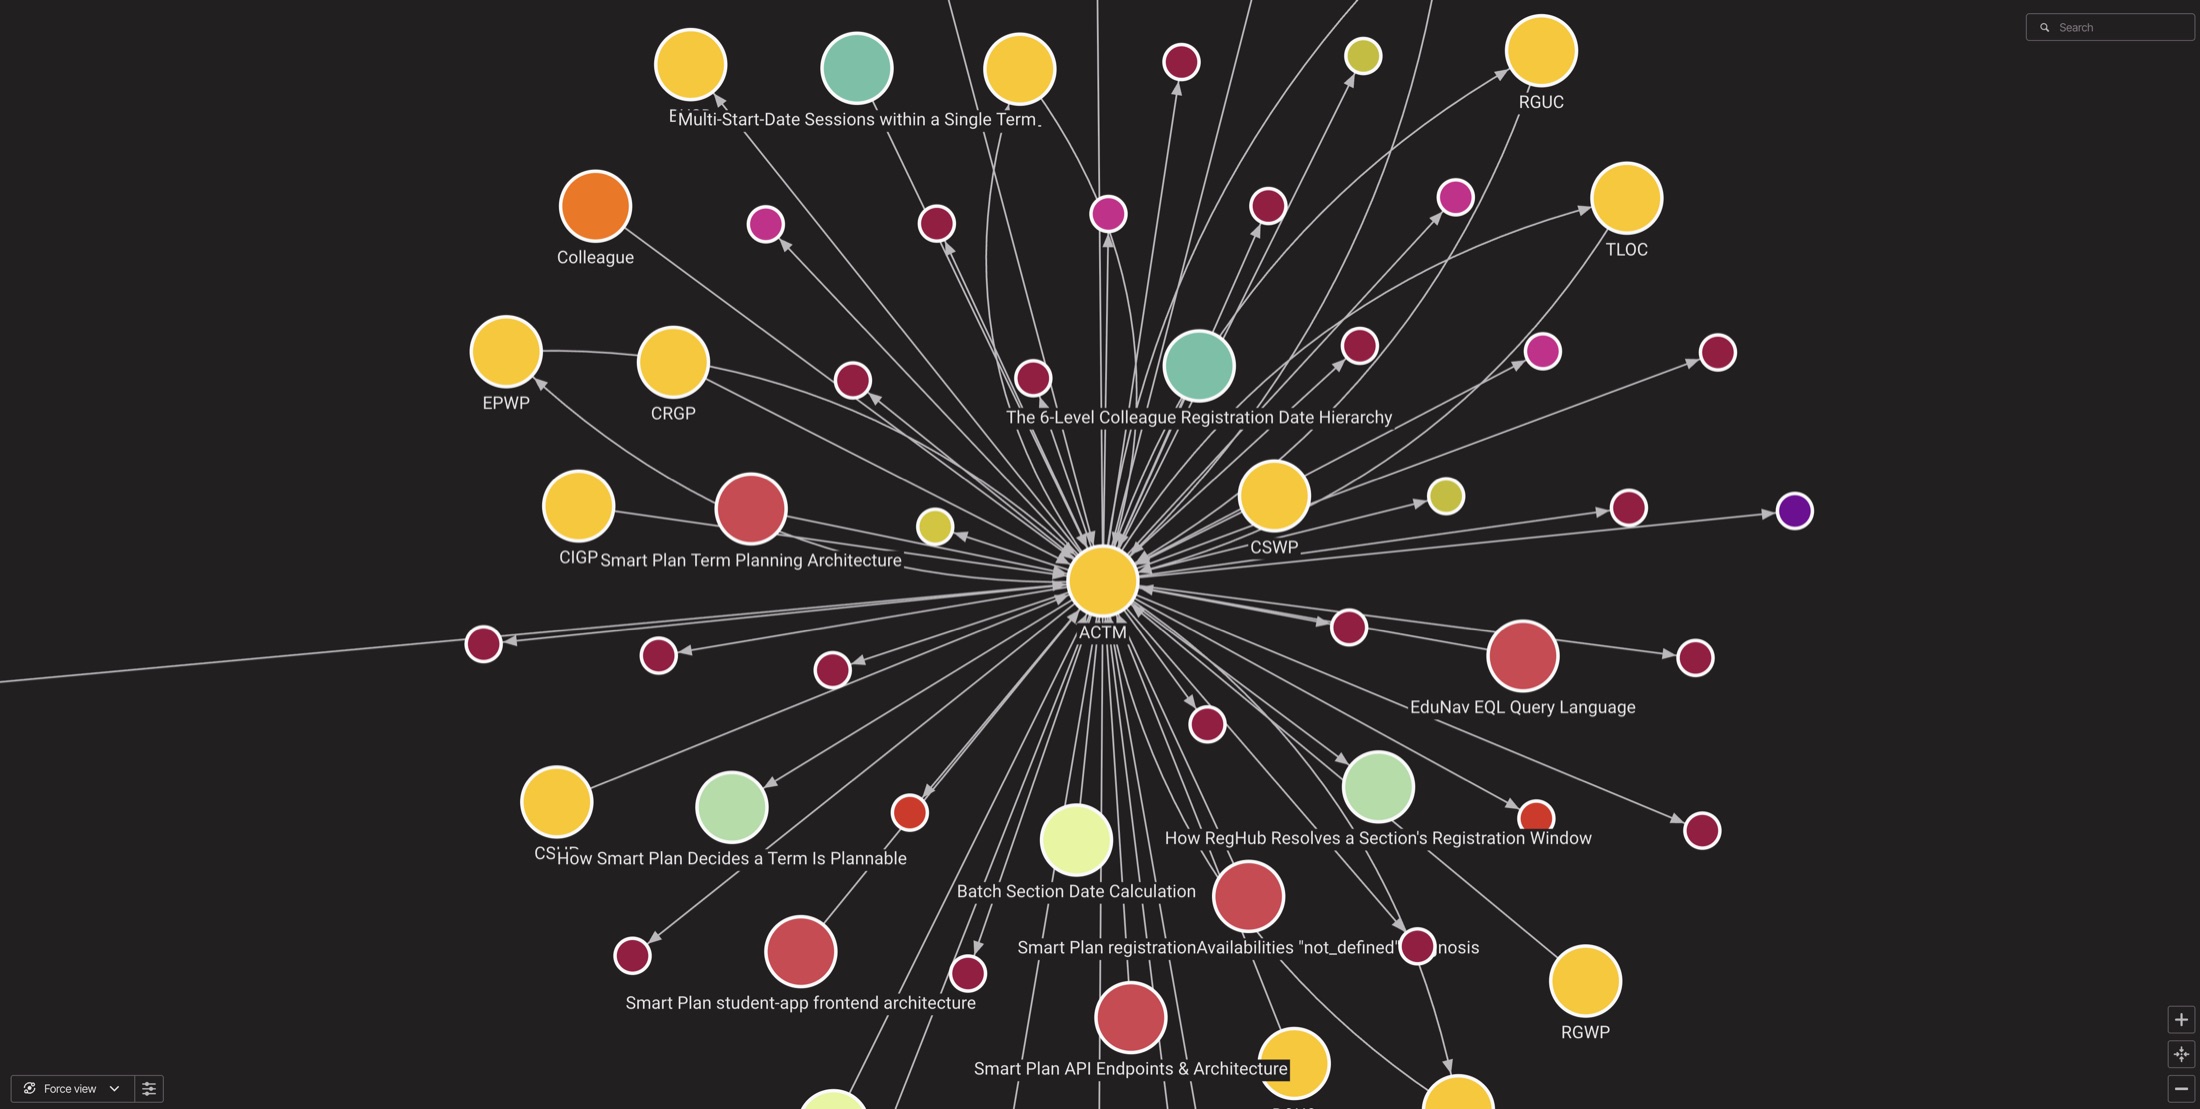
fig.01 — entities and the relationships between them4,612 nodes · 5,920 edges · 237 files
4,600+ interconnected nodes — the institution's policies, systems, screens, and processes rendered as one navigable map.
An institution knows an enormous amount — almost none of it written down in a way you can follow.
Which policy does this system enforce? Who owns the process that breaks if we change it? The answers lived in people's heads and scattered documents, and the connections between them — the part that actually matters — were invisible. You couldn't see the whole, so you couldn't reason about it.
237 source files are parsed into typed entities and, crucially, the relationships between them — enforces, owns, depends-on. Loaded into Memgraph and explored in Memgraph Lab, the map answers questions a document never could: trace any node and see everything it touches, in every direction.
Relationships are first-class, not footnotes. Modeling the edges is what turns a pile of facts into something you can actually query.
Before you change anything, you can see what depends on it. Institutional knowledge stops being tribal and starts being legible.
New staff onboard against a map instead of a rumor. Impact analysis takes minutes. The knowledge was always there — the graph just makes it something the whole institution can hold at once.